Population Statistics
Statistics Canada produces statistics that help Canadians better understand their country—its population, resources, economy, society and culture. On February 9, 2022 Statistics Canada released the 2021 Population Statistics.
The 2021 Census population for the Regional District of Nanaimo is 170,367. Of this number, 26 per cent (43,745) live in electoral areas and First Nation communities and the remaining 74 per cent (126,625) live in municipalities. Click on the Populations Statistics tab below to see a full breakdown of the population within the Regional District of Nanaimo.
- Population Statistics
- Population Statistics
Population Statistics Area Population Electoral Area 2001 2006 2011 2016 2021 2001-2006
% change2006-2011
% change2011-2016
% change2016-2021
% changeA 6,423 6,751 6,908 7,058 7,481 5.1% 2.3% 2.2% 6.0% B 3,522 4,050 4,045 4,033 4,500 15.0% -0.1% -0.3% 11.6% C a 1,932 2,508 2,834 2,808 3,344 29.8% 13.0% -0.9% 19.1% E 4,820 5,462 5,674 6,125 6,765 13.3% 3.9% 7.9% 10.4% F 5,546 6,680 7,422 7,724 8,216 20.4% 11.1% 4.1% 6.4% G b 6,113 7,023 7,158 7,465 8,109 14.9% 1.9% 4.3% 8.6% H 3,108 3,474 3,509 3,884 4,291 11.8% 1.0% 10.7% 10.5% Electoral Area Total 31,464 35,948 37,550 39,097 42,709 14.3% 4.5% 4.1% 9.2% Population statistics Area Population Municipalities 2001 2006 2011 2016 2021 2001-2006
% change2006-2011
% change2011-2016
% change2016-2021
% changeNanaimo 73,000 78,692 83,810 90,504 99,863 7.8% 6.5% 8.0% 10.3% Parksville 10,323 10,993 11,977 12,514 13,642 6.5% 9.0% 4.5% 9.0% Lantzville a 3,653 3,661 3,601 3,605 3,817 0.2% -1.6% 0.1% 5.9% Qualicum Beach b 7,849 8,502 8,687 8,943 9,303 8.3% 2.2% 2.9% 4.0% Municipalities Total 94,825 101,848 108,075 115,566 126,625 7.4% 6.1% 6.9% 9.6% Population statistics Area Population First Nation Reserves 2001 2006 2011 2016 2021 2001-2006
% change2006-2011
% change2011-2016
% change2016-2021
% changeSnuyneymuxw 1 238 279 377 360 386 17.2% 35.1% -4.5% 7.2% Snuyneymuxw 2 20 21 26 20 37 5.0% 23.8% -23.1% 85.0% Snuyneymuxw 3 33 50 81 92 67 51.5% 62.0% 13.6% -27.2% Snuyneymuxw 4 158 208 180 259 219 31.6% -13.5% 43.9% -15.4% Nanoose 207 191 204 230 245 -7.7% 6.8% 12.7% 6.5% Qualicum 71 86 81 74 82 21.1% -5.8% -8.6% 10.8% First Nations Total 727 835 949 1,035 1,036 14.9% 13.7% 9.1% 0.1% Population statistics Area RDN 2001 2006 2011 2016 2021 2001-2006
% change2006-2011
% change2011-2016
% change2016-2021
% changeTotal Population c 127,016 138,631 146,574 155,698 170,367 9.1% 5.7% 6.2% 9.4% Source: Statistics Canada, www.statcan.gc.ca (2001, 2006, 2011, 2016 and 2021 Canadian Census)
The 2001 population is adjusted to reflect that Area D was incorporated into Area C and Lantzville. The 2001 population is adjusted to take into account boundary changes between the 2001 and 2006 Censuses - Population Growth Chart
-
- Census Profiles
-
Electoral Areas:
- Electoral Area A
- Electoral Area B
- Electoral Area C
- Electoral Area E
- Electoral Area F
- Electoral Area G
- Electoral Area H
Municipalities:
First Nation Reserves:
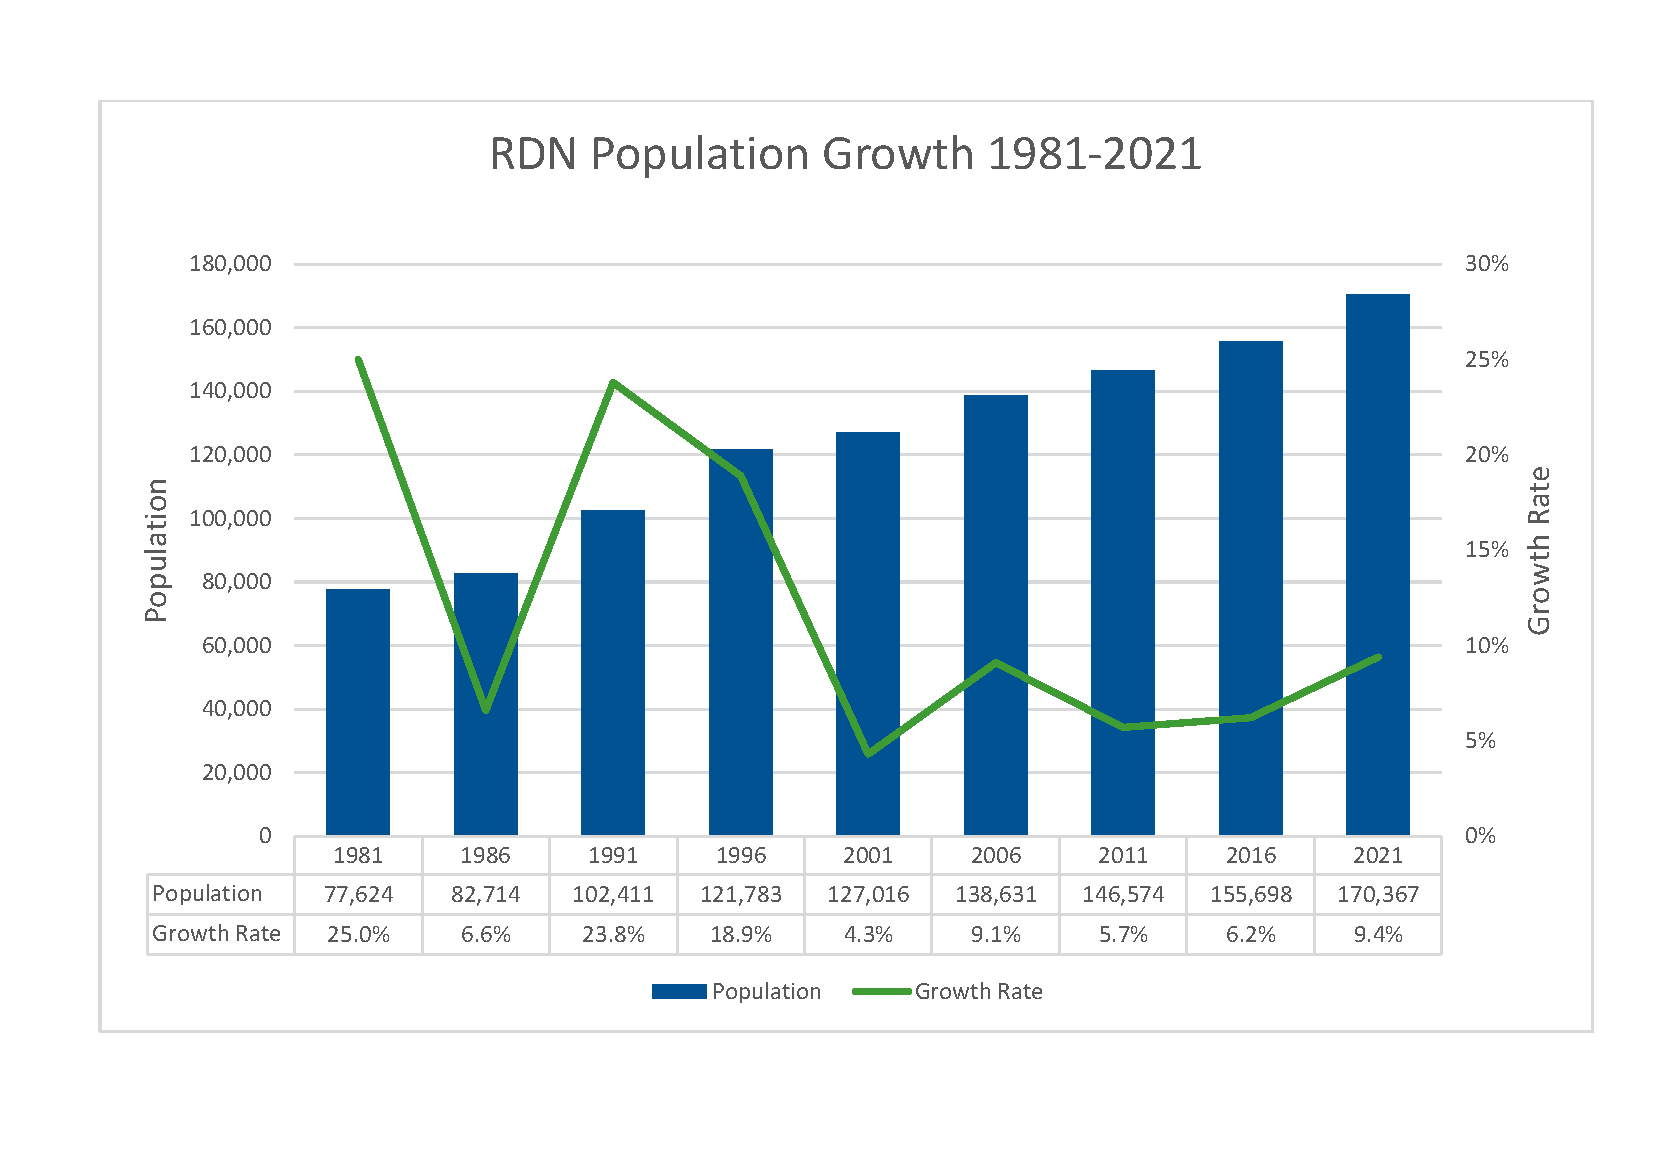
- Population Growth 1981-2021
-
The population of the region increased from 77,624 residents in 1981 to 170,367 residents in 2021. This means an increase of 119% during that time at a growth rate of approximately 3 per cent per year, on average.
Population growth rates in the Regional District have fluctuated over the past 40 years during different census periods. These highs and lows are the result of a range of factors including migration, aging as well as births and deaths.
Population statistics Census Year Estimated Population Census Period Census Period Growth Rate (%) Average Annual Growth Rate (%) 1981 77,624 1976-1981 25 5 1986 82,714 1981-1986 7 1.4 1991 102,411 1986-1991 24 4.8 1996 121,783 1991-1996 19 3.8 2001 127,016 1996-2001 4 0.8 2006 138,631 2001-2006 9 1.8 2011 146,574 2006-2011 6 1.2 2016 155,698 2011-2016 6 1.2 2021 170,367 2016-2021 9 1.8 Source: Statistics Canada - Future Population Growth
-
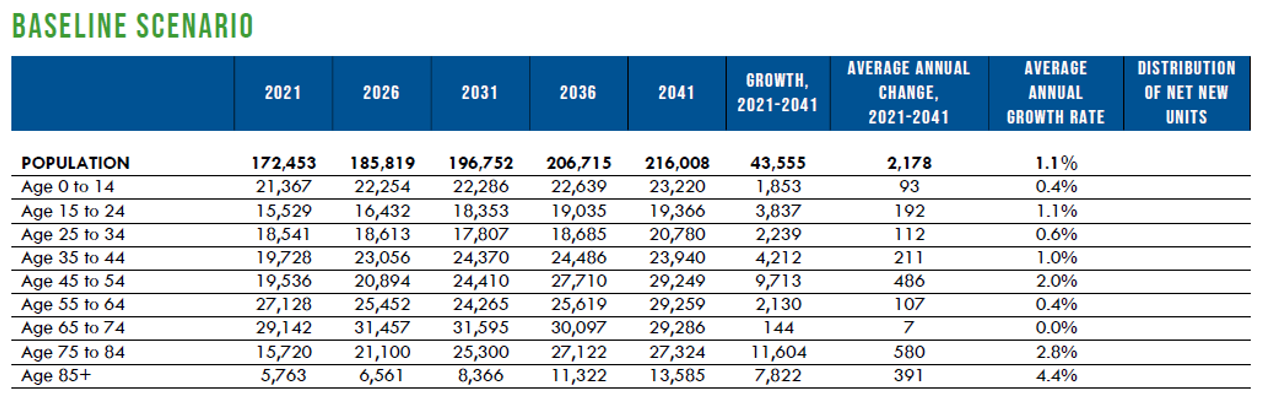
The Regional Housing Needs Report, completed in 2020, includes population growth for the region over the next 20 years. The original projections were based on the 2016 Census Year and has since been updated given the release of 2021 Census Year data.
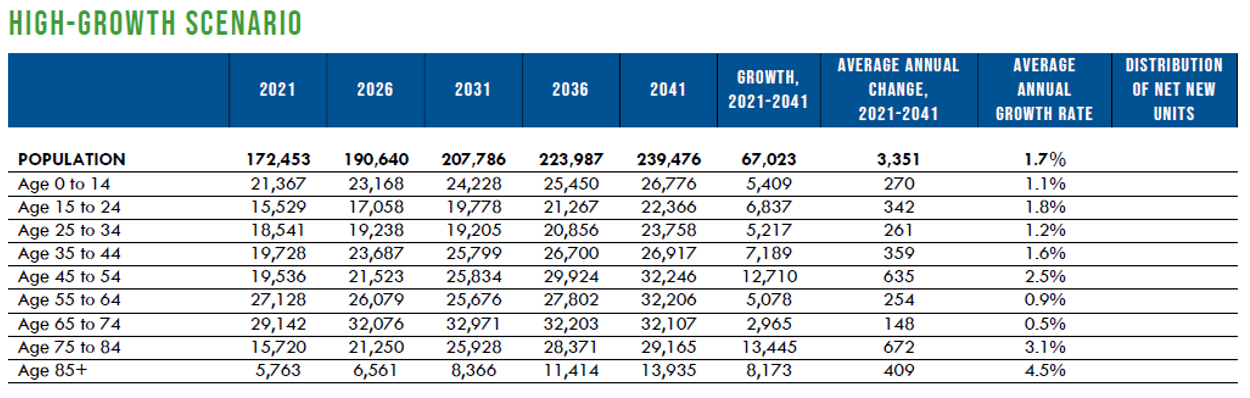
These projects represent the region’s current growth path allowing for some adjustments in national growth. Given annual growth rates may vary between rural and urban areas, a baseline and High Growth Scenario is provided, The Baseline Scenario is considered representative of the region.
Baseline Scenario is based on 1.1 % growth per year, showing an increase from 172,453 people in 2021 to 185,819 in 2026, and an estimated 216,008 people by 2041.
High Growth Scenario assumes a higher rate of net migration with a growth rate of 1.7 per cent annually. Under this scenario, the region’s population is estimated to increase from 172,453 people in 2021 to 190,640 in 2026, and to an estimated 239,476 people by 2041.
Note, the population projections are based on the 2021 Census Year, adjusted to account for “net Census undercoverage”. Undercoverage is the percentage of the population that is missed by the Census (balanced against those who are double counted).
Updated population projections (2021-2041) prepared by Vann Struth Consulting Group for the RDN:
- Additional Information and Resources
Fax: 250-390-7511 | E-mail: askplanning [at] rdn.bc.ca